Tired of relying on spreadsheets to bring your data together?
Turn the data you already have into intelligence your team can use.
Leverage the scattered files, system reports, spreadsheets and existing software exports you already use and turn them into decision-ready insights your team needs.
Every missed overcharge, duplicated cost, unprofitable job or delayed report can quietly drain margin while your team is still reconciling files.
Conifr's AI-assisted data structuring and Charlie AI analysis tool helps teams get from messy data to trusted insight in weeks for focused use cases, all without hiring a data team or running a major implementation.
Give each team a clearer view of the same operating reality.
Conifr is useful when the answer exists somewhere across your systems, reports, files and workflows, but no one can easily bring it together, trust it or act on it.
Executives
Which parts of the business are actually profitable, where is margin leaking, and what needs attention this month?
Finance
Are costs allocated correctly, are supplier charges consistent with agreed rates, and can the numbers be reconciled to source evidence?
Operations
Which assets, jobs, sites, teams or workflows are underperforming, and what operational patterns are driving the result?
Commercial teams
Which customers, contracts, services or projects need review because pricing, cost assumptions or activity patterns have changed?
Start with a business problem your team is already struggling with.
If your team is still manually combining invoices, exports, reports and spreadsheets, you are spending time on work that AI can help remove, and you're probably missing the exceptions that are costing the organisation money.
Find vendor overcharging
Compare supplier invoices against quotes, agreed rate cards, procurement schedules or historical pricing to identify overcharges, unusual price movements and mismatched line items.
Explore accounts payable automationUnderstand customer or job profitability
Bring revenue, labour, materials, subcontractor costs and operational activity into one view so teams can see which jobs, customers or projects are actually profitable.
Explore financial reportingInvestigate cost leakage
Reconcile operational records, finance exports, invoices and system reports to find duplicated costs, missing credits, unallocated spend or cost movements buried in spreadsheets.
Explore financial reportingSpot operational underperformance
Compare activity, utilisation, output, cost and exception data across assets, teams, sites or workflows to identify where performance is drifting from expectation.
Explore the BI platformReplace manual reporting packs
Centralise recurring files, exports and source evidence into a repeatable reporting model so monthly analysis is less dependent on manual spreadsheet work.
Explore financial reportingAsk better questions with Charlie AI
Use Charlie AI on top of trusted business data to ask what changed, where variance appeared, which records explain the movement and what should be investigated first.
Explore the BI platformNot just data preparation. Not just dashboards. Useful Insight.
Conifr combines the data foundation and the insight generation layer required to move from scattered business data to trusted Operations Data Intelligence.
Practical ingestion
Conifr starts with the fastest reliable path to the data: uploaded files, CSVs, spreadsheets, emailed reports, system exports, REST/SOAP APIs or connector-based ingestion where appropriate.
- Start before every API is ready.
- Use the files and reports teams already produce.
- Automate and deepen connections over time.
Data structuring
Conifr turns inconsistent source material into usable operational and financial tables that can support reporting, analysis and AI-assisted questions.
- Parse and classify reports, files and documents.
- Map source fields into clean tables.
- Standardise records across fragmented sources.
Business logic and reconciliation
Conifr applies the rules, relationships and calculations that make data meaningful: costs, margins, rates, variances, activity links and source evidence.
- Validate logic with finance and operations users.
- Connect source records to reporting outcomes.
- Create repeatable rules instead of one-off spreadsheets.
Semantic model
A semantic model — in plain English, a trusted business meaning layer — keeps metrics, relationships and KPI definitions consistent across dashboards and AI analysis.
- Consistent definitions across leadership views.
- Reusable relationships between customers, jobs, suppliers, assets and costs.
- Clearer governance over how metrics are calculated.
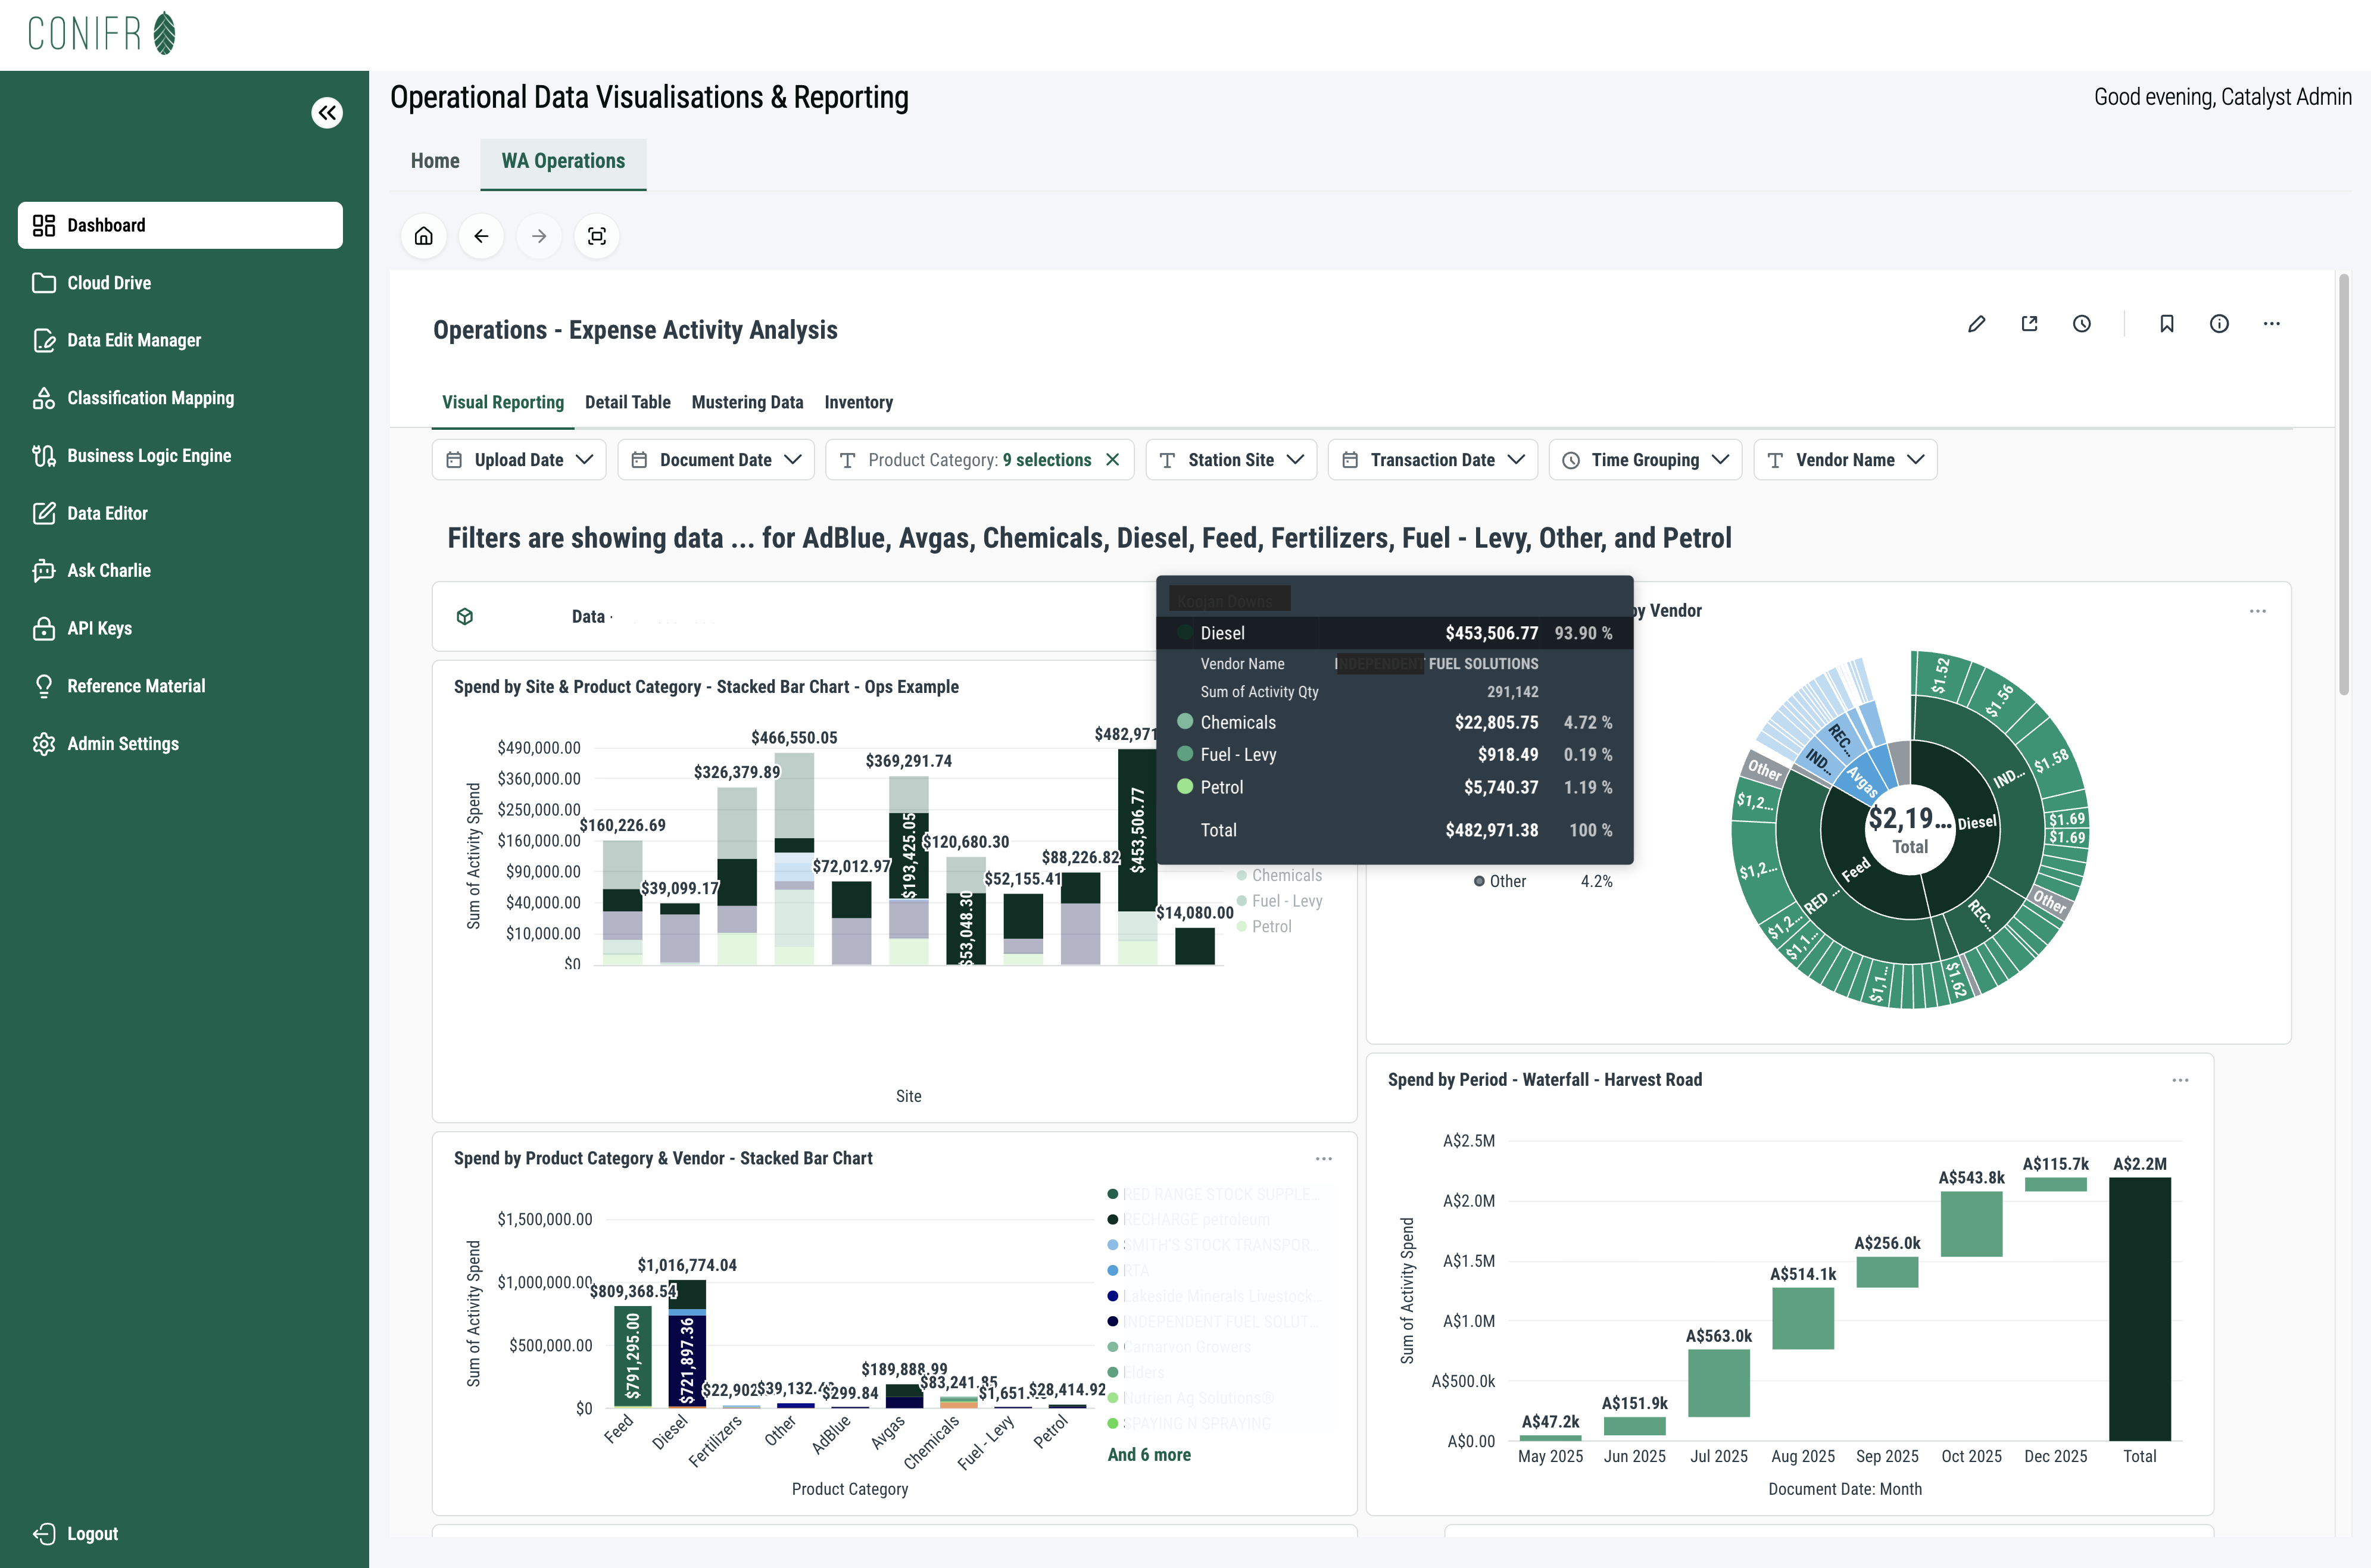
Interactive dashboards
Conifr delivers business intelligence views designed for exploration, not static screenshots. Teams can filter, slice, drill down and review the records behind the result.
- Cross-filtering across KPI views.
- Drill-down and drill-through analysis.
- Underlying record and source evidence review.
Charlie AI
Charlie AI helps users ask questions of the trusted intelligence layer, investigate variances and understand what changed without waiting for manual analysis.
- Ask plain-English questions of business data.
- Summarise changes and exceptions.
- Guide users towards the next useful investigation.
Interactive operational analysis, built on trusted business logic.
Conifr dashboards sit on a managed relational data model and semantic model (which is a trusted business meaning layer) that defines how source data relates and how each KPI should be calculated.
- Interactive cross-filtering: click a data point, customer, supplier, activity or asset to slice related dashboard views.
- Deep drill-through analysis: move from a high-level KPI to the detail records that explain the result.
- Ad hoc visual querying: explore operational data, change parameters and investigate without writing SQL.
- Conversational AI analysis: Charlie AI helps users ask what changed, why it changed and where to investigate next.
You don't need to struggle with spreadsheets or large data projects anymore.
Conifr gives teams a faster, lower-burden path to trusted reporting. We handle the data warehousing, connections, structuring and intelligence layer so your team does not need to hire a data team or manage a major consultant-led build.
| Traditional software / BI project | Conifr approach |
|---|---|
| Traditional projects start with software selection, requirements gathering and technical design. | Conifr starts with the business decision, reporting gap or operational question. |
| Traditional projects wait for integrations to be designed, approved, built and tested. | Conifr uses the data already available to prove whether the insight is useful. |
| Traditional implementation models require the client to operate the data stack with a heavy internal project team. | Conifr reduces the client-side project and operating burden. |
| Traditional BI assumes the data foundation is already clean. | Conifr builds the clean intelligence foundation before relying on dashboards. |
| Traditional projects often build too much before proving value. | Conifr proves value through focused use cases and progressive activation. |
| Traditional software is often sold as a tool the client must configure, manage and maintain. | Conifr is delivered and maintained as an outcome-led intelligence layer. |
Start with one business question.
Bring one reporting gap, one file export, one spreadsheet or one operational question. Conifr can help determine the fastest path from available data to decision-ready insight.